Introduction
Performance issues in Business Central rarely come with clear answers.
Users report that posting feels slow, a page behaves inconsistently, or a process that used to work smoothly now takes longer. Consultants try to reproduce the issue. Developers are asked to investigate. And very quickly, the discussion turns into assumptions — the database, data volume, customizations, or simply “how SaaS behaves.”
The real challenge isn’t fixing performance problems. It’s understanding what actually happens between the moment a user clicks an action and the moment Business Central finishes processing it.
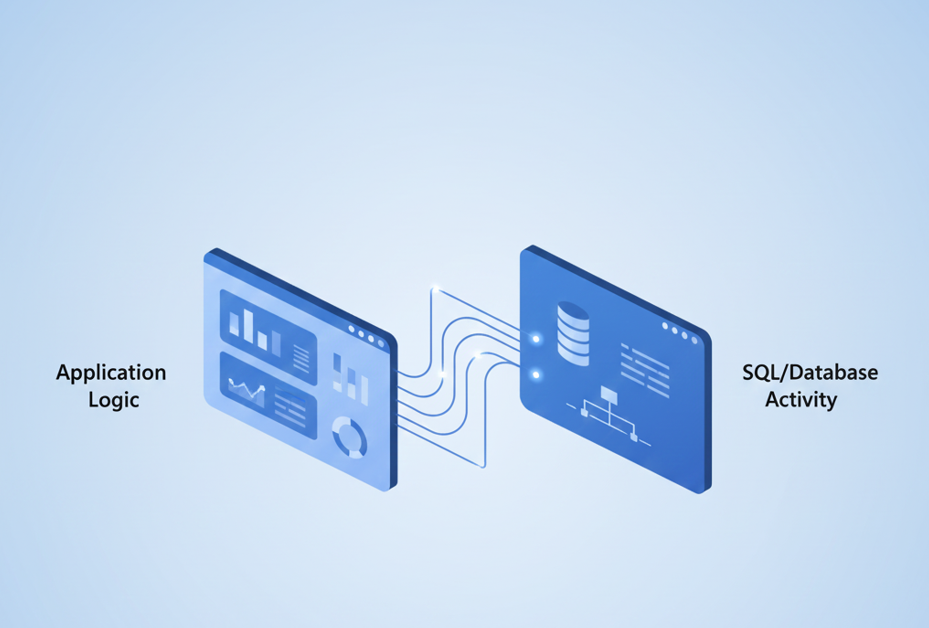
Until recently, performance analysis in Business Central focused mainly on application execution. While that provided valuable insight, it left an important question unanswered: how much of the time is spent accessing data, and how much is spent executing business logic?
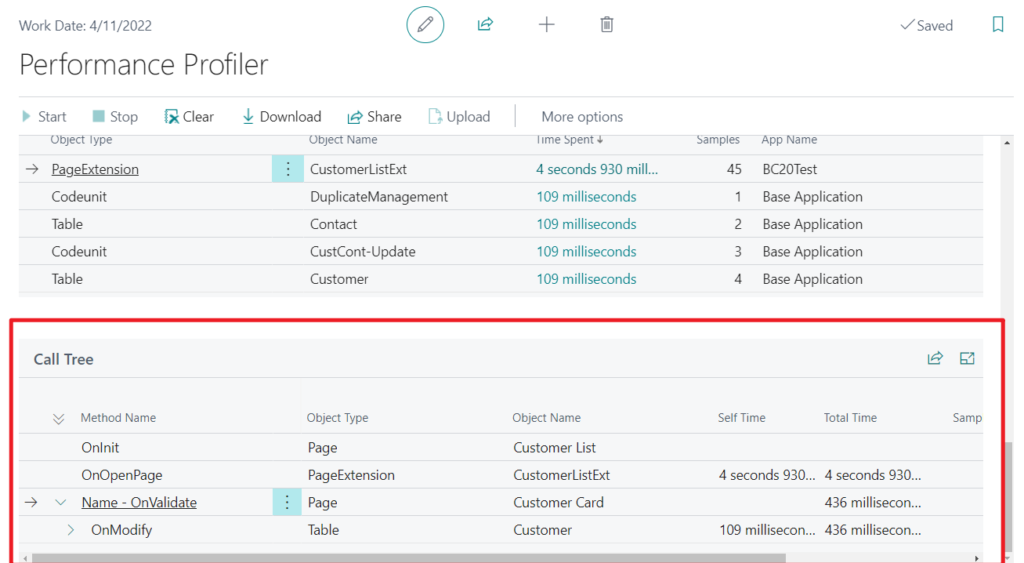
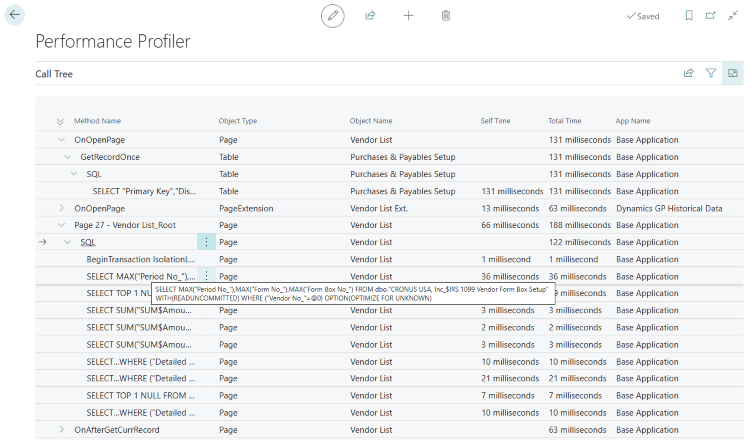
With Business Central 2025 Release Wave 2, performance profiles introduce SQL call visibility, closing a long-standing observability gap.
Why performance analysis has been challenging
Performance profiling has existed in Business Central for some time, but historically it focused on execution flow — which operations were triggered and how long they took at the application level.
What was missing was clear insight into database activity:
- How often the system interacts with the database
- How much time is spent on those interactions
- How database activity relates to the overall execution timeline
Without that context, performance investigations often relied on experience and intuition. It was difficult to confidently answer whether a slowdown was caused by:
- Business logic
- Configuration choices
- Data volume
- Or database access
As a result, conversations frequently ended with vague conclusions rather than evidence-based explanations.
What SQL call visibility adds
SQL call visibility does not change how Business Central works. Instead, it changes how we observe it.
By surfacing SQL call information directly in performance profiles, Business Central now allows you to see:
- How many SQL calls are executed during an action
- How much total time is spent on database operations
- How database activity aligns with application execution
This additional layer of insight helps answer questions that were previously difficult to address:
- Is this action logic-heavy or data-heavy?
- Is the system slow, or is it simply doing more work?
- Are configuration choices influencing runtime behavior?
It’s important to emphasize that this capability is about classification and understanding, not automatic optimization.
How to read SQL call information responsibly
SQL call visibility is powerful, but it needs to be interpreted carefully.
A higher number of SQL calls does not automatically indicate a problem. Likewise, longer SQL execution time does not necessarily mean poor performance. In many cases, it simply reflects that the system is performing additional, expected work.
When reviewing SQL call information:
- Look for patterns rather than individual numbers
- Compare similar actions under similar conditions
- Consider configuration and process design before drawing conclusions
Most importantly, SQL visibility should be used to explain behavior, not to assign blame.
What SQL call visibility does not tell you
To use this feature effectively, it’s equally important to understand its limitations.
SQL call visibility:
- Does not replace SQL Profiler or database-level diagnostics
- Does not show execution plans or indexing details
- Does not identify “the slow query”
- Does not automatically indicate what should be optimized
Its role is to provide context, not to act as a tuning tool.
This distinction is critical to avoid misinterpretation and premature conclusions.
Where SQL call visibility is most useful
Even without dramatic performance differences, SQL call visibility adds value in many real-world situations:
- When posting feels slower after an upgrade
- When two environments behave differently under similar usage
- When large datasets behave differently than smaller ones
- When configuration choices appear to influence runtime behavior
- When explaining performance behavior to non-technical stakeholders
In these cases, having concrete insight into database activity helps move discussions from opinions to evidence.
How this changes performance conversations
The biggest benefit of SQL call visibility is not technical — it’s communicative.
It allows consultants, developers, and customers to:
- Share a common understanding of what the system is doing
- Separate expected workload from unexpected issues
- Explain performance behavior clearly and confidently
- Reduce assumptions about “SQL being slow”
Performance profiles become less about diagnosing failures and more about understanding system behavior.
Key takeaways
- Performance issues are often about visibility, not defects
- SQL call visibility adds critical context to performance profiles
- More SQL activity does not automatically mean worse performance
- Configuration and design choices influence runtime behavior
- Evidence-based analysis leads to better decisions and clearer explanations
Business Central 2025 Release Wave 2 doesn’t change how performance works — but it significantly improves how we can understand and explain it.